
This report gives you the ability to view, on a week-by-week basis, how your therapists are performing. You will be able to choose from a variety of values to filter the report with.
Navigating to the Report
To access this report, navigate to Reports > Snapshot Reports > Provider Weekly Totals.
The Layout
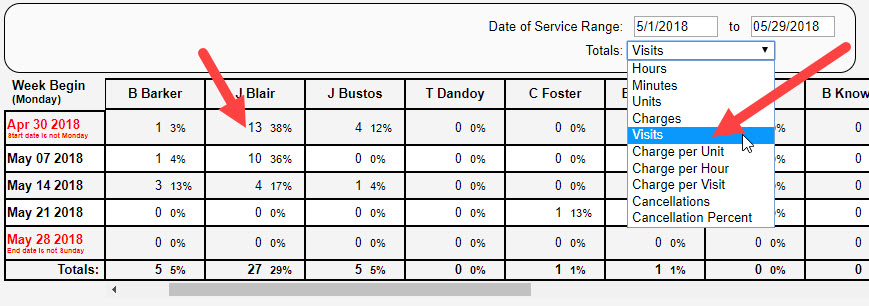
Once you choose a Date of Service Range and Totals, Therabill will create a summary of weekly totals for you. Each row of the report is a week (beginning Monday and ending on Sunday). The first and last row may appear altered if you do not choose a start date as a Monday or an end date as a Sunday.
Start/End Date is Not Monday/Sunday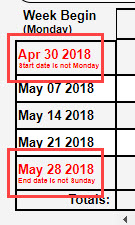
If the first/last row appears red, then it indicated that the start/end date is not a Monday/Sunday. This means that the values in that row will not be totals for an entire week's worth of data. If you do this, be careful when comparing values from these rows to values in other rows as the number of days is not equal. This often occurs when running this report for an entire month.
Your Therapists
Each column in the report is one of your therapists. Only the first initial and last name of the therapist is displayed. If you have a lot of therapists, you may need to scroll from left to right using the scroll bar at the bottom of the report to view all of the therapists and see the totals at the end.
The Values
The values within the reports are totals for the week (the row) and the therapist (the column). You can choose different totals to view. The available options are Hours, Minutes, Units, Charges, Visits, Charge per Unit, Charge per Hour, Charge per Visit, Cancellations, and Cancellation Percent.
For a session to be included in the totals, it must meet the following criteria:
- The session must be confirmed.
- The session must have a client/patient assigned to it.
Some of the values will display as a total and a percentage. The percentage is calculated on a weekly basis. Values that show as a total and a percentage are marked with an * in the list below.
- Hours* - This is the total number of scheduled hours for that provider during that week. The hours are calculated using the start time and end time that is listed in the session.
- Minutes* - This is the total number of scheduled minutes for that provider during that week. The hours are calculated using the start time and end time that is listed in the session.
- Units* - This is the total number of units (from each service code) for that provider during that week.
- Charges* - This is the total charge amount for all services for that provider during that week.
- Visits* - This is the total number of visits/sessions for that provider during that week.
- Charge per Unit - The total Charges divided by the total number of Units for that provider during that week.
- Charge per Visit - The total Charges divided by the total number of Visits for that provider during that week.
- Cancellations*- The total number of visits that have a cancellation session class assigned to them.
- Cancellation Percentage - The total number of Cancellations divided by the total number of Visits. This can be read as the percentage of scheduled sessions that were cancelled.
Note: Time-based values (hours and minutes) are not useful for integrated clinics, as all sessions are listed as 1 hour.
Comments
0 comments
Article is closed for comments.